ASP.NET Core Health Checks
When you are developing a project where you have multiple services talking to each other, it would be hard to see their service health instantly.
This article will look at how we can configure ASP.NET Core health checks and look into what kind of different metrics we can gather from it.
💡 Follow along with the code samples for this blog post from this repo.
The setup
I will be using ASP.NET’s MVC and template, as most of you are familiar with it. However, you can also use other project types such as API, Console or even Blazor.
Let’s scaffold an MVC app.
dotnet new mvc -n Monitor
dotnet new sln
dotnet sln add Monitor
First, we need to install the HealthChecks package.
cd Monitor/
dotnet add package AspNetCore.HealthChecks.UI
Now we are ready to hook it up to the middleware pipeline.
Application Configuration
Navigate to the Startup.cs and, let’s add the following in the ConfigureServices method.
services.AddHealthChecks();For starters, we will add an endpoint to spit out a JSON to show the app’s current status.
app.UseEndpoints(endpoints =>
{
    endpoints.MapControllerRoute(
        name: "default",
        pattern: "{controller=Home}/{action=Index}/{id?}");

		// Mapping a new endpoint to see the health
    endpoints.MapHealthChecks("/health");
});
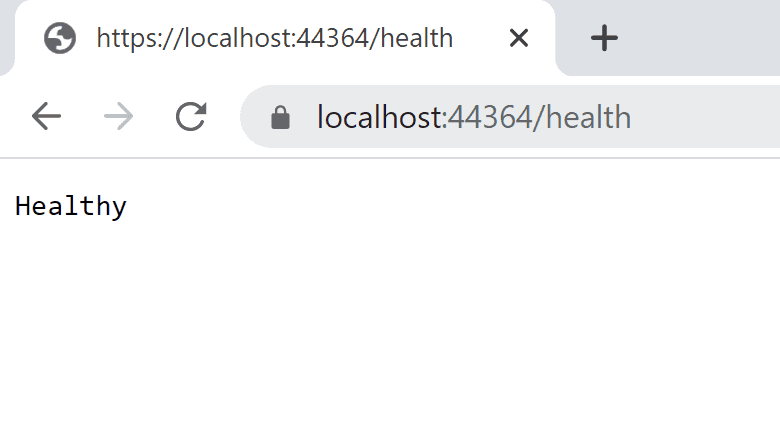
Well, that isn’t particularly useful. This health checks package we are using provides many different output formats. They have made it extensible so that you can even use a custom output format. If you have many services talking to each other, it will make sense to use a format like JSON.
💡 Feel free to skip this section and jump ahead to “Registering health checks” section to see the final result.
Health checks UI dashboard
We are interested in seeing is a Dashboard that comes out-of-the-box. We will use our current project as a monitoring app to probe in and check the health status of some other applications that are running. The following diagram explains our desired state.
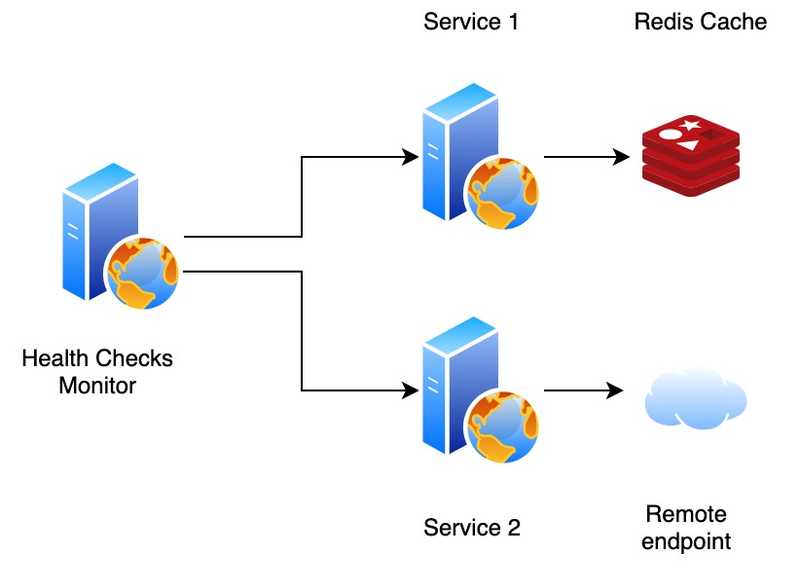
Let’s get to a point we can see something visually and start extending our solution on top of that. To be able to use the dashboard, it needs to have a backing store. We need to bring in a package called AspNetCore.HealthChecks.UI.InMemory.Storage
dotnet add package AspNetCore.HealthChecks.UI.InMemory.StorageLet’s change the code in our Startup/ConfigureServices class. Replace the previous code with the following.
// ..
services.AddHealthChecksUI()
        .AddInMemoryStorage();
// ..
Next, let’s map a new endpoint to be able to see the dashboard.
// ...
app.UseEndpoints(endpoints =>
{
    endpoints.MapControllerRoute(
        name: "default",
        pattern: "{controller=Home}/{action=Index}/{id?}");

    endpoints.MapHealthChecksUI();
});

//...
Now we are ready to run the application and see what we get.
dotnet new webapi -n Service1
dotnet new webapi -n Service2
dotnet sln add Service1 Service2
We need to add the health checks middleware to the two projects we created in the above step.
Startup.cs
public void ConfigureServices(IServiceCollection services)
{
		// ...
    services.AddHealthChecks();
		// ...
}

app.UseEndpoints(endpoints =>
{
    // ...
    endpoints.MapHealthChecks("/health", new HealthCheckOptions()
    {
        ResponseWriter = UIResponseWriter.WriteHealthCheckUIResponse
    });
		// ...
});
Just copy and add the following lines to the .csproj files of the two services we created.
<PackageReference Include="AspNetCore.HealthChecks.UI" Version="5.0.1" />
<PackageReference Include="AspNetCore.HealthChecks.UI.Client" Version="5.0.1" />
Finally, you need to add the endpoints of the services to our Monitor project. Let’s add the following bit to the appsettings.json file of the Monitor project. Head over to the official docs to learn more about the configuration.
"HealthChecksUI": {
  "HealthChecks": [
    {
      "Name": "Service 1",
      "Uri": "https://localhost:5011/health"
    },
    {
      "Name": "Service 2",
      "Uri": "https://localhost:5021/health"
    }
  ],
  "EvaluationTimeInSeconds": 10
},
💡 Don’t forget to take the port numbers your servers are running on from the corresponding launchSettings.json files. This could change depending on whether you are using IIS Express or Kestrel for development.
If you fire up the 3 projects now, you will be able to see the health checks dashboard.
The default URI for the dashboard UI is https://localhost:<app port>/healthchecks-ui
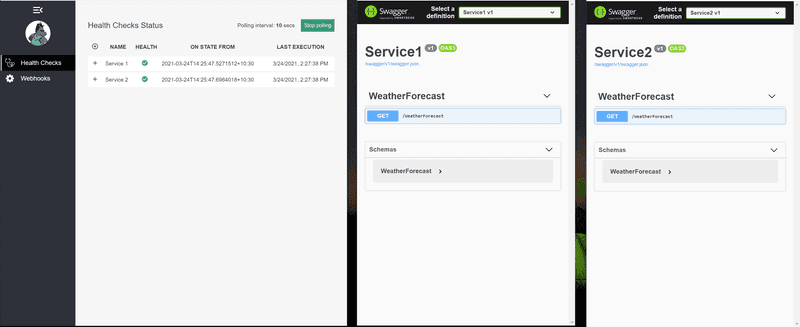
Under the hood, this small SPA dashboard polls the /healthchecks-api URI which returns a JSON.
Registering health checks
Without bringing in any other dependencies let’s simulate the 3 states that it will report to us:
Head over here to see a complete list of supported health checks. Let’s add some dummy health checks to see them in action in the dashboard.
We will replace the code in Service1/Startup.cs with the following.
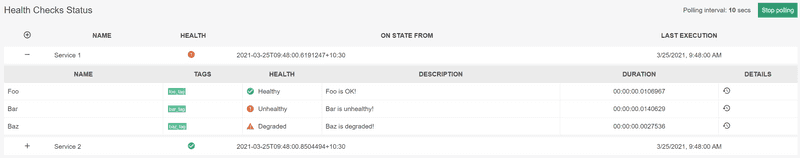
services.AddHealthChecks()
    .AddCheck("Foo", () =>
        HealthCheckResult.Healthy("Foo is OK!"), tags: new[] { "foo_tag" })
    .AddCheck("Bar", () =>
        HealthCheckResult.Unhealthy("Bar is unhealthy!"), tags: new[] { "bar_tag" })
    .AddCheck("Baz", () =>
        HealthCheckResult.Degraded("Baz is degraded!"), tags: new[] { "baz_tag" });
In my previous blog post, I showed you how we could easily integrate with the Redis. I will be using AspNetCore.HealthChecks.Redis package to configure the health checks.
dotnet add package AspNetCore.HealthChecks.RedisWe will also add this configuration bit to its appsettings.json file.
"Redis": {
  "ConnectionString":  "localhost:5002"
},
Let’s spin up a Redis docker container on port 5002.
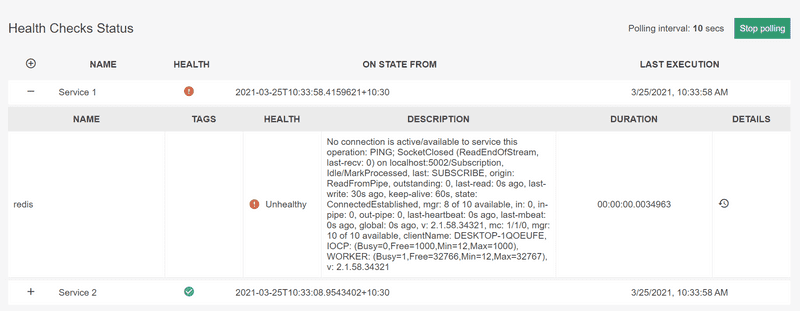
docker run --name redis-cache -p 5002:6379 -d redisDashboard:
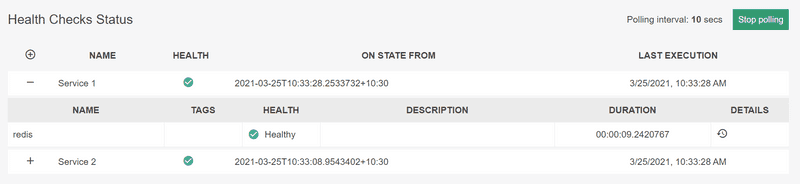
Feel free to stop the docker container and see how the errors get displayed in the dashboard.
Adding custom health checks
Now let’s switch to our Service2 project and do something interesting with it as well. We are going to be adding our custom health check.
public class RemoteHealthCheck : IHealthCheck
{
    public Task<HealthCheckResult> CheckHealthAsync(HealthCheckContext context, CancellationToken cancellationToken = new CancellationToken())
    {
        var isHealthy = CheckRemoteEndpointHealth();

        return Task.FromResult(isHealthy ?
            HealthCheckResult.Healthy("Remote endpoint is healthy.") :
            HealthCheckResult.Unhealthy("Remote endpoint is unhealthy"));
    }

    private bool CheckRemoteEndpointHealth()
    {
        // Just stubbing it out for demo
        var rnd = new Random().Next(1, 5);
        return rnd % 2 != 0;
    }
}
We can now register RemoteHealthCheck in the Startup class like so.
services.AddHealthChecks()
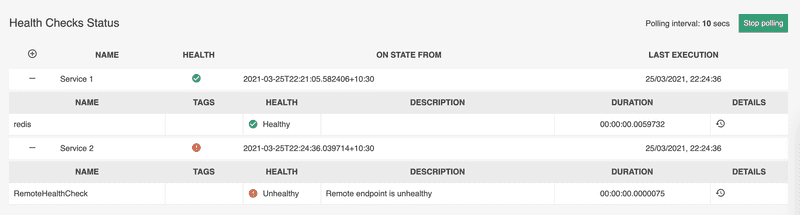
.AddCheck<RemoteHealthCheck>(nameof(RemoteHealthCheck));Now the dashboard will show you the status of both services.
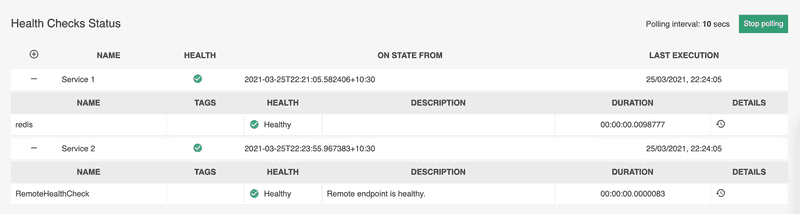
You’ll see that the RemoteHealthCheck will be going down from time to time because we have set it to return an unhealthy randomly. You can also set the EvaluationTimeInSeconds setting to like 2s to see the result quickly.
Conclusion
Today we looked at how you can improve your developer experience by leveraging ASP.NET’s health checks. There are so many providers and configurations to play around with. Feel free to head over to the docs to learn more.